
How to Measure Student Engagement That Actually Matters

You open your learning platform and see a reassuring pattern. Students have logged in, watched the recorded lecture, posted in the discussion board and submitted the first task on time. The dashboard looks healthy. Then the seminar begins. Several students appear uncertain, the questions reveal basic misunderstandings, and the learners who were most active online say very little.
That mismatch is common because student engagement isn't one observable behaviour. It includes what students do, how they think and whether they feel connected enough to continue. If you're working out how to measure student engagement, the reliable answer isn't another isolated dashboard. It's a triangulated view that brings behavioural, cognitive and emotional signals together, with UK benchmarks such as UKES providing context rather than pretending to measure learning on their own.
The Moment Your Classroom Data Surprised You
A lecturer on a blended undergraduate module once described a familiar Monday morning. The learning management system showed frequent logins, strong viewing activity and a lively forum. A recorded lecture had been replayed repeatedly, and nearly every student had opened the accompanying reading.
The lecturer expected the seminar to feel energetic. Instead, the first practical activity stalled. Students could repeat the terminology from the lecture, but they struggled to explain how the concepts related. One student had watched the recording several times because the argument wasn't clear, not because the material had been mastered. Another had posted short comments to meet the discussion requirement, then admitted privately that they hadn't understood the week's central idea.
A useful warning: activity tells you that a student interacted with a learning environment. It doesn't tell you what that interaction meant.
Many measurement programmes go wrong. They collect whatever the platform produces easily, then use those figures as a proxy for attention, understanding and commitment. Clicks, attendance records and video plays are evidence, but they're incomplete evidence. A high count can represent curiosity, confusion, accessibility needs, repeated searching or simple compliance.
The reverse problem matters too. A quiet student may read carefully, annotate a paper and develop a strong explanation without posting often. If you only inspect visible activity, you may label that learner disengaged and miss the quality of their thinking.
UK higher education has developed more structured ways to examine this problem. The UK Engagement Survey has run for over 10 years and uses 29 questions across seven categories, showing how institutions can treat engagement as a set of dimensions rather than a single score (Advance HE's UKES 2023 analysis). The practical lesson is simple: build a measurement system that compares different kinds of evidence before deciding who needs support or which teaching activity needs redesigning.
Three Types of Engagement You Must Measure Together
Start with three questions:
What did the student do?
How did the student process the learning?
How did the student feel about participating?
These questions correspond to behavioural, cognitive and emotional engagement. Each offers useful information, but none can stand in for the others.
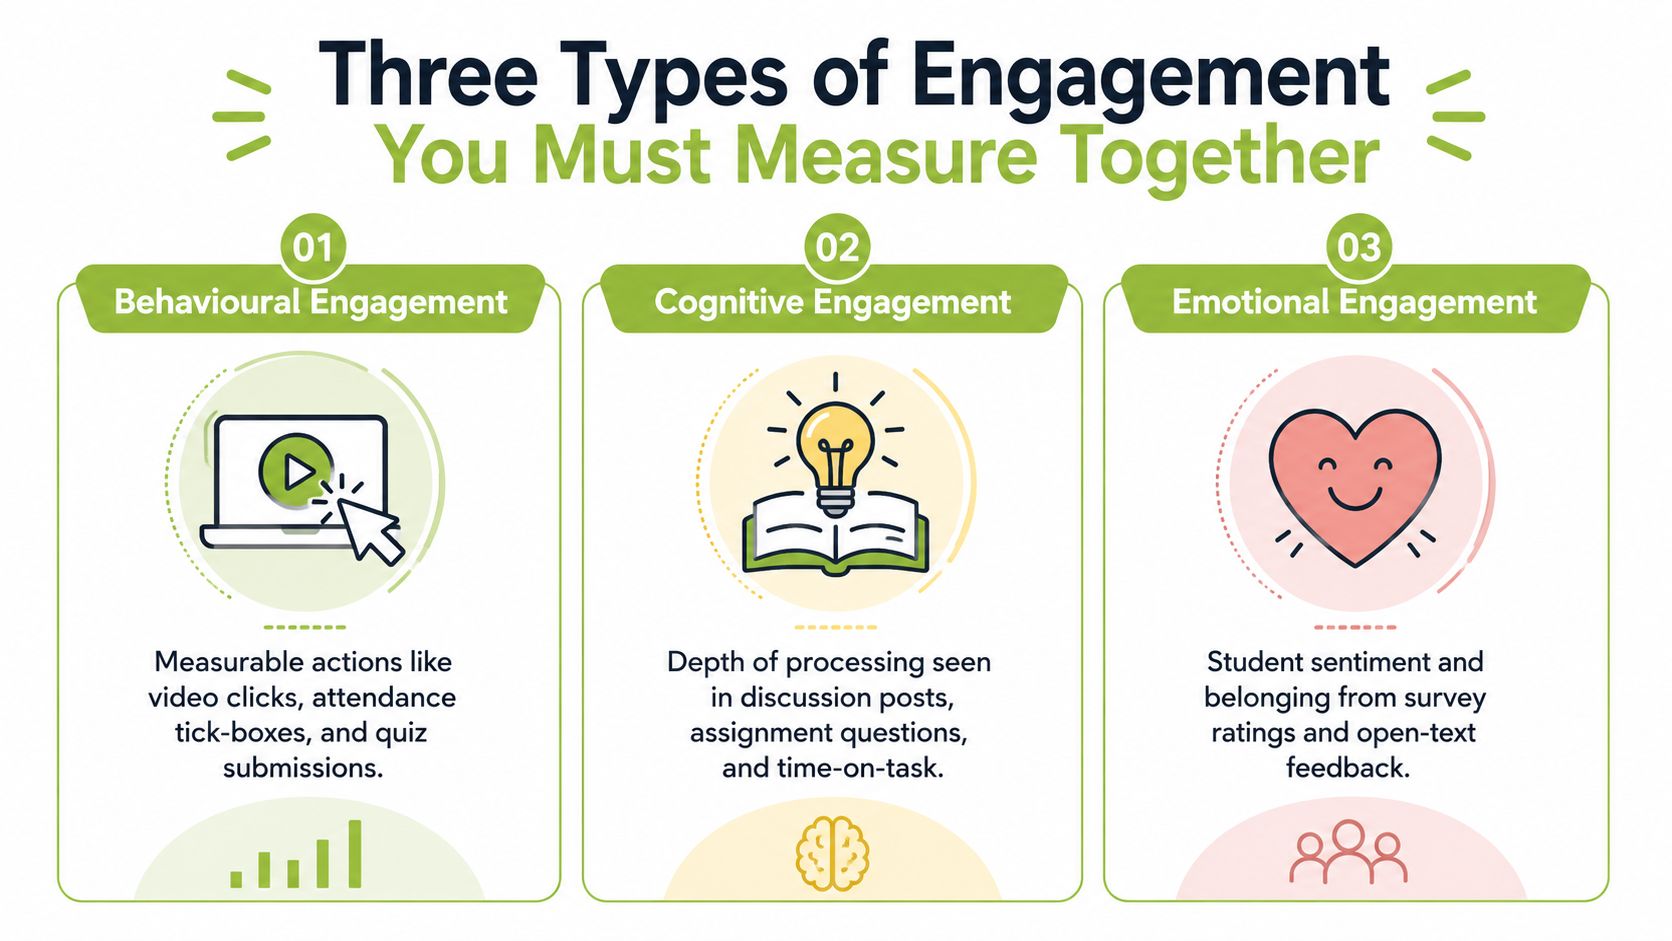
Behavioural engagement shows visible action
This is the easiest layer to collect. You might examine attendance, LMS logins, video plays, completion events, quiz submissions, resource access and forum contributions. These measures help you see whether students are reaching the learning experience and following the expected route through it.
Consider an undergraduate who rewatches every lecture. That pattern looks positive until a tutorial reveals that the student is replaying sections because they can't identify the main argument. The behaviour is real, but its interpretation changes once you add evidence of understanding.
Cognitive engagement reveals the quality of processing
Cognitive engagement concerns depth of thinking, self-regulation and strategy use. A student may contribute little to a whole-class discussion while mentally mapping a reading, comparing theories and preparing a precise question.
You can look for this in an explanation, a draft, a reflective journal or a student's response to a misconception check. Ask learners to talk through how they approached a problem, not just whether they reached the right answer. That think-aloud evidence can reveal planning, monitoring and revision that a login record can't capture.
Emotional engagement explains return and persistence
Interest, belonging, frustration, confidence and anxiety shape whether students take another step. A student can attend every seminar and complete every task while feeling invisible in group work. Another may appear hesitant because they're anxious about being judged, not because they lack interest.
Short pulse questions and open-text prompts can surface these experiences. Practical ideas such as simple student engagement tips can help staff create safer opportunities for participation, but the measurement still needs to ask whether students feel included and able to contribute.
Use the three layers together. Behavioural data shows what students did, cognitive evidence shows how they processed it, and emotional evidence shows whether they cared enough to return next week. For guidance on connecting evaluation activity with learning media, see MEDIAL's evaluation and assessment guidance.
What the UK Engagement Survey Measures
A programme team can see high attendance and active discussion in one module, yet receive weaker student feedback than expected. The UK Engagement Survey, or UKES, helps explain why by treating engagement as several connected experiences rather than one satisfaction score. Its core instrument uses 29 questions across seven categories, with compulsory and optional sections covering engagement, skills development, and time spent on academic and extra-curricular work (UKES methodology and reporting).
Local reports may use slightly different labels, but the practical questions remain familiar. They examine active learning, academic challenge, interaction with staff, learning with others, independent learning, reflection, and skills development. UKES can also support questions about course challenge, research engagement, and staff-student partnership. These areas give programme teams clearer points for action than asking only whether students are satisfied.
UKES Scale Categories and What Each One Reveals
UKES Category | What It Measures | Typical Use |
|---|---|---|
Active learning | Whether students participate actively in learning activities | Review teaching activities and preparation tasks |
Academic challenge | Whether work requires sustained and demanding thought | Examine curriculum level and assessment design |
Learning with others | Whether students learn through collaboration and discussion | Identify strengths and barriers in group learning |
Interaction with staff | Whether students engage with teaching staff and receive academic contact | Review tutorials, feedback and approachability |
Reflecting and connecting | Whether students connect ideas across topics and contexts | Improve synthesis tasks and reflective activities |
Staff-student partnership | Whether students have a meaningful role in learning relationships | Strengthen student voice and co-design |
Skills development | Whether students perceive growth in transferable and academic skills | Track development across a programme |
UKES is a self-report instrument, not a performance test. A high response describes how students perceive their engagement and learning experience. It cannot show by itself whether a student understood a concept or achieved a particular outcome. Read it alongside LMS activity, video analytics, assessment evidence, and learner conversations. Those sources act like different lenses on the same classroom. One shows participation, another shows thinking, and UKES shows how students interpret the experience.
The survey also supports comparison over time. Its first pilot in 2015 gathered 24,387 responses from 24 institutions. By 2019, reporting had expanded to 29,784 participants across 31 institutions, creating a basis for longitudinal analysis (Advance HE's UKES reporting). A separate development account reports cognitive testing with 85 students before national measurement (UK Parliament research briefing).
Use UKES at programme level, then add short module pulses and learning-media analytics, including video viewing patterns where available. If students report strong engagement but produce limited interaction or weak explanations, examine the mismatch rather than averaging it away. Raw institutional comparisons also need care because student mix and local context can affect simple averages. Adjusted or multilevel analysis provides a safer basis for benchmarking.
Building Your Measurement Stack Step by Step
A workable stack doesn't need every available data source. It needs different evidence types, named owners and a clear response when a signal changes. The following model can operate within a term and can be scaled from one module to a programme.
Layer one captures behaviour
The module administrator exports LMS events for logins, page dwell time, video completion and assignment milestones. The learning technologist maps video-platform events, including viewing position and replays, to the same field structure used for native LMS activity. The weekly trigger is a missed milestone or an unusual change in access, not a target number of clicks.
Layer two examines thinking
The module lead creates a five-level rubric for forum posts, draft submissions and reflective journals. Two markers score a sample consistently and compare their interpretations before the rubric is used across the module. The trigger is a flat or declining pattern in explanation quality across assessed or formative work.
Layer three listens for emotional signals
The student experience lead runs two short pulse surveys during the term. Adapt item wording from established UKES supplementary scales where appropriate rather than writing a collection of untested questions. The trigger is a meaningful shift in confidence, belonging or perceived relevance, followed by a conversation rather than an automatic label.
Layer four adds learner voice
A tutor organises a ten-minute focus group every fortnight with a rotating student panel. The discussion is transcribed and tagged against themes such as workload, clarity, belonging and access. The trigger is a repeated theme that helps explain a pattern in the other layers.
Layer | Instrument | Data Source | Cadence | Owner |
|---|---|---|---|---|
Behavioural | LMS and video event report | LMS and MEDIAL activity | Weekly | Learning technologist |
Cognitive | Five-level engagement rubric | Posts, drafts and journals | At each submission | Module lead and markers |
Emotional | Short pulse survey | Student responses | Twice per term | Student experience lead |
Qualitative | Rotating focus group | Transcripts and coded themes | Fortnightly | Tutor or student partnership lead |
Keep the reporting purpose visible. A measurement programme should tell a tutor whether to clarify a resource, contact a learner, redesign a seminar or investigate a belonging issue. Examples of how to define a baseline before tracking change can be found in these event planning baseline examples, which are useful when a team needs to agree what “normal” looks like before interpreting movement.
For reporting design, MEDIAL's performance reporting guidance offers a useful reference point for organising platform information. The important principle is not the product name. It's the mapping of each event to a decision and the protection of student privacy through proportionate access, clear purposes and secure handling.
Turning Behavioural, Cognitive and Emotional Data Into One View
A joined view should simplify decisions without pretending that the signals mean the same thing. Give each student three status flags, then record the evidence behind each flag.
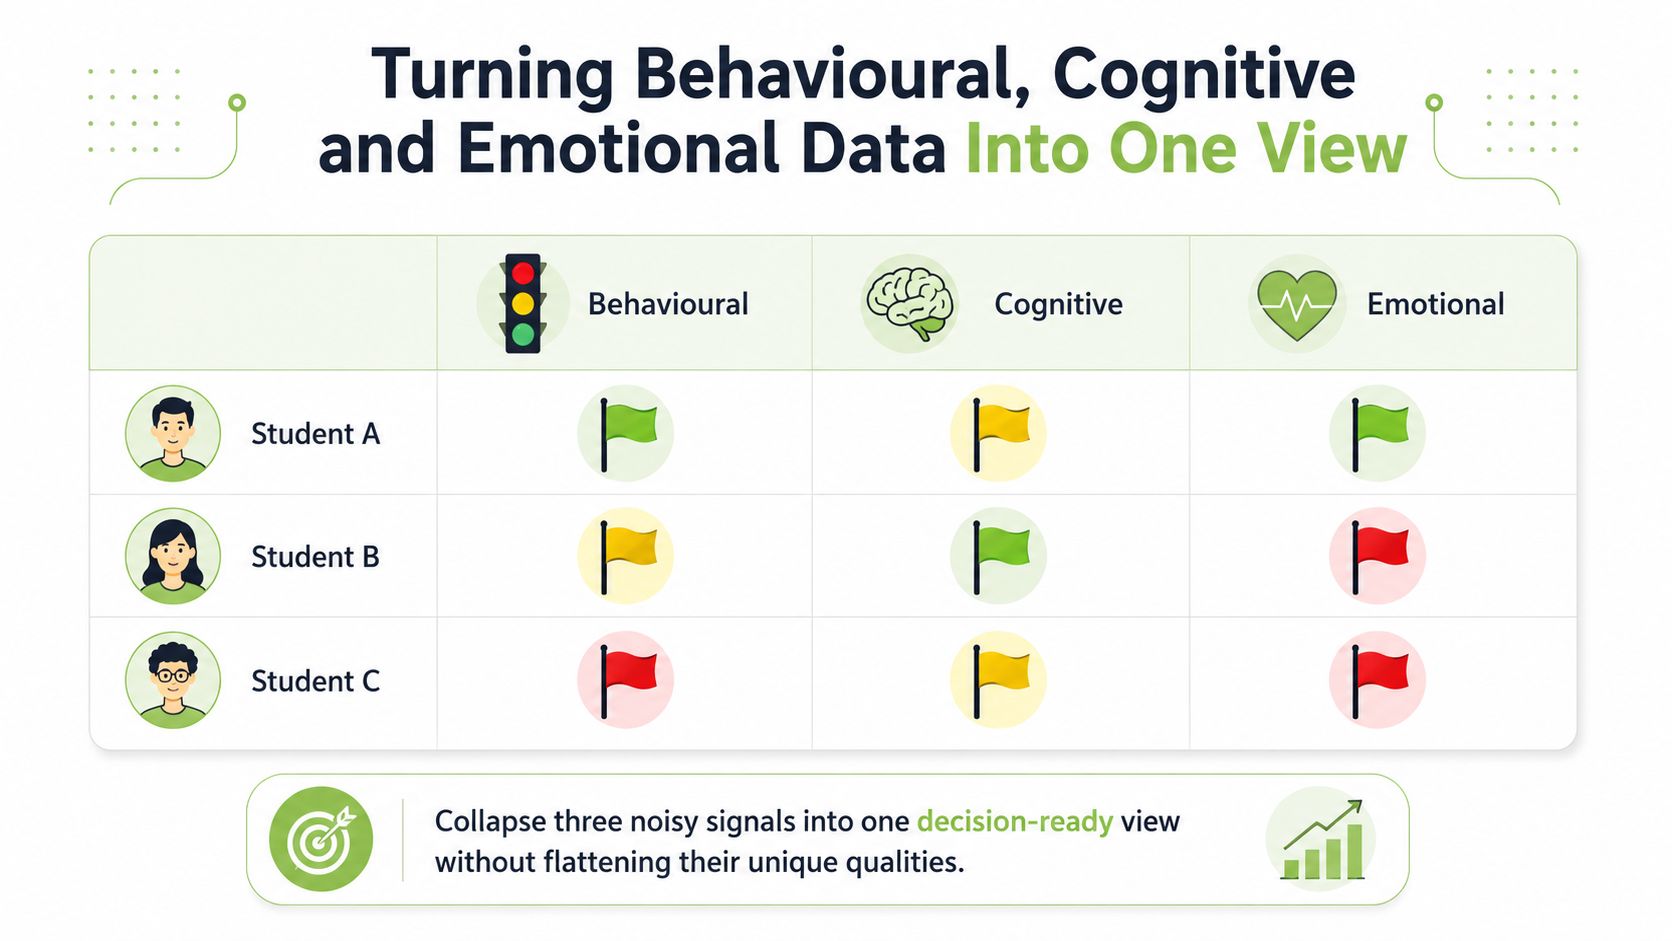
Use a straightforward rule:
Green means the current evidence is consistent and no immediate action is needed.
Amber means one signal has changed or the evidence is incomplete, so a tutor checks the context.
Red means multiple signals point to a risk, or a serious concern needs a prompt response.
Student | Behavioural flag | Cognitive flag | Emotional flag | Immediate reading |
|---|---|---|---|---|
Student A | Green | Green | Green | Continue normal support |
Student B | Green | Red | Amber | Check understanding and confidence |
Student C | Amber | Green | Red | Ask about access, belonging or workload |
Take Student B. Their MEDIAL record shows regular replays, their submissions arrive on time and their visible activity appears steady. The cognitive rubric, however, remains flat across three assessments. Their response to the confidence item has also fallen. The joined view identifies a learner who is present and compliant but may not understand the material or feel able to ask for help.
A tutor shouldn't respond by sending a generic “You haven't logged in enough” message. A better intervention is a short conversation about the difficult concept, followed by a low-stakes explanation task and a check on confidence. The behavioural evidence explains access, while the rubric and pulse response explain why access hasn't translated into stronger learning.
Student C needs a different response. Behaviour has dipped, cognitive work remains sound and emotional confidence is low. That pattern could reflect a temporary personal difficulty, a sense of exclusion or a problem with the learning environment. Contact should begin with an open question, not an assumption that the student is failing.
Keep the joined view readable. A dashboard such as MEDIAL's analytics dashboard can support the behavioural layer, but your team still needs rubric and pulse data beside it. A meeting should end with a named action, owner and review point, not another exported chart.
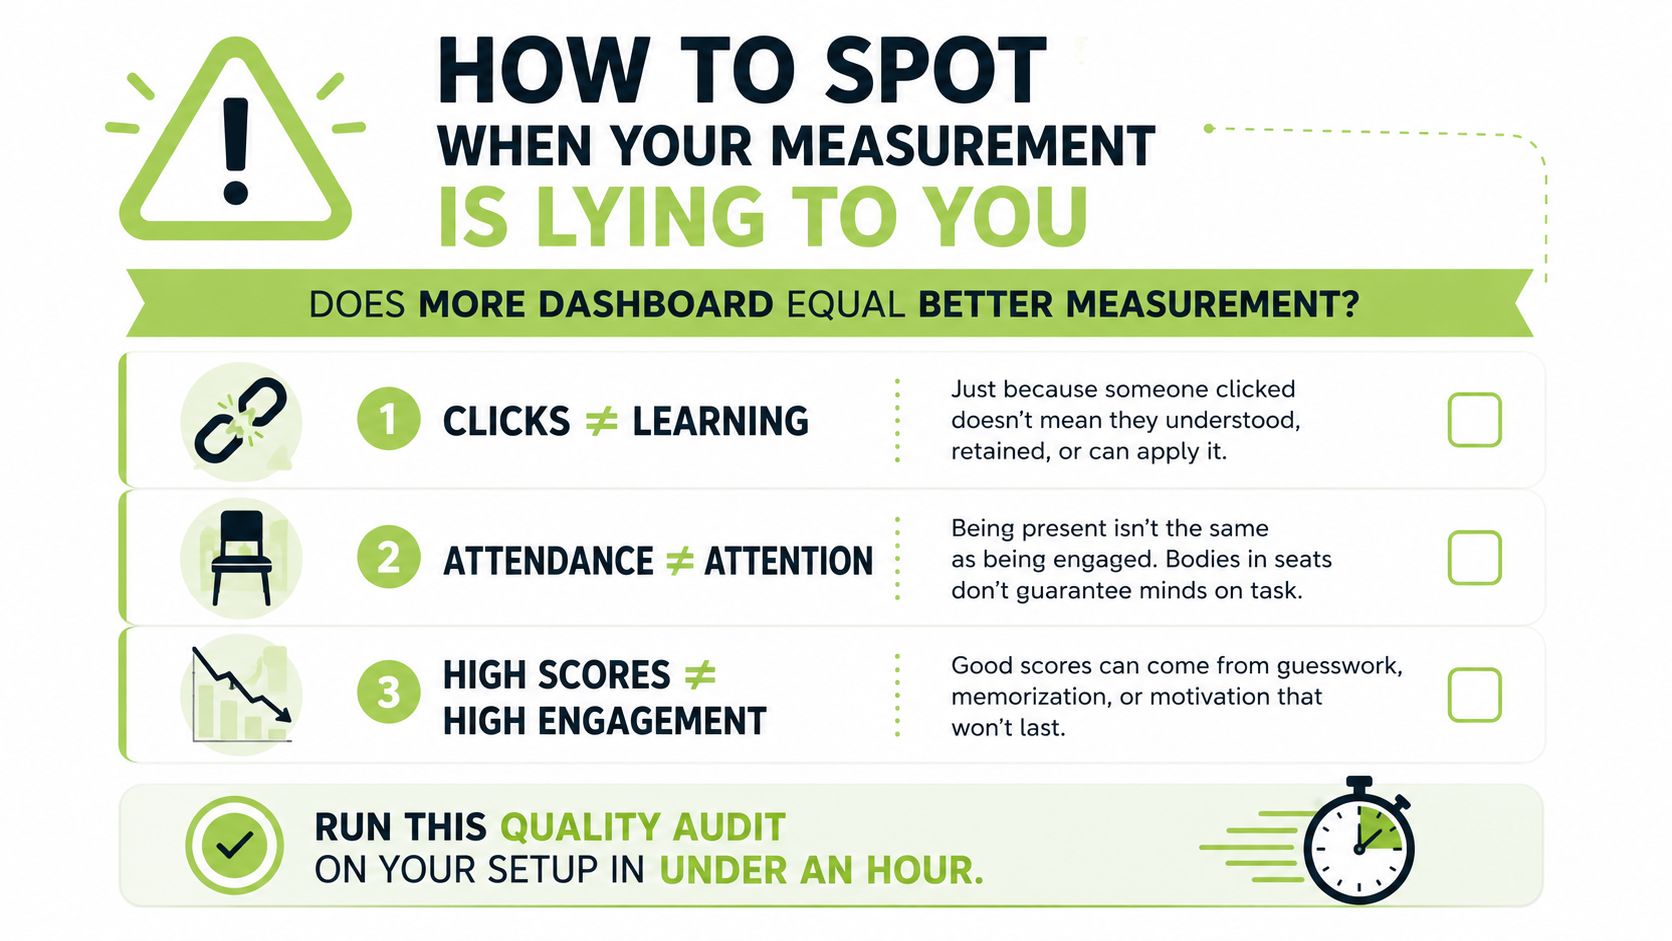
How to Spot When Your Measurement Is Lying to You
A dashboard can show rising activity while learning is weakening. The risk appears when staff count convenient signals, such as clicks or attendance, and treat them as evidence of understanding or belonging.
Audit each measure against five questions:
Representativeness: Do responses include different groups of students, or mainly regular volunteers?
Triangulation: Does an important conclusion draw on behavioural, cognitive and emotional evidence, rather than one signal?
Validity: Does the measure relate sensibly to attainment, understanding or the experience it claims to track?
Marker reliability: Do markers apply the engagement rubric consistently, or do scores drift during the term?
Recency: Is the evidence current enough for staff to intervene while support can still help?
Use three out of five as an internal pass mark. A measure that falls short can remain temporarily if the team records its limitation, defines its use and sets a prompt review.
Four common measurement traps
LMS clicks may increase while assessment explanations grow weaker. A pulse survey may look positive because the same small group responds repeatedly. Video analytics can record autoplay or a completed player event without showing attention. Attendance can confirm presence while a student remains confused or emotionally disconnected.
Read these signals like weather instruments. One gauge can suggest a change, but several readings provide a safer basis for action. UKES can provide a useful benchmark and early warning, as noted earlier, yet local learning evidence and student conversations are still needed to explain what a concerning pattern means.
A single number rarely predicts an outcome on its own. Compare behavioural activity with cognitive work and emotional responses, then check whether the combined pattern matches what tutors see in teaching and assessment.
For every metric on your dashboard, name the decision it will change next week. If nobody can name one, retire the metric or redesign it.
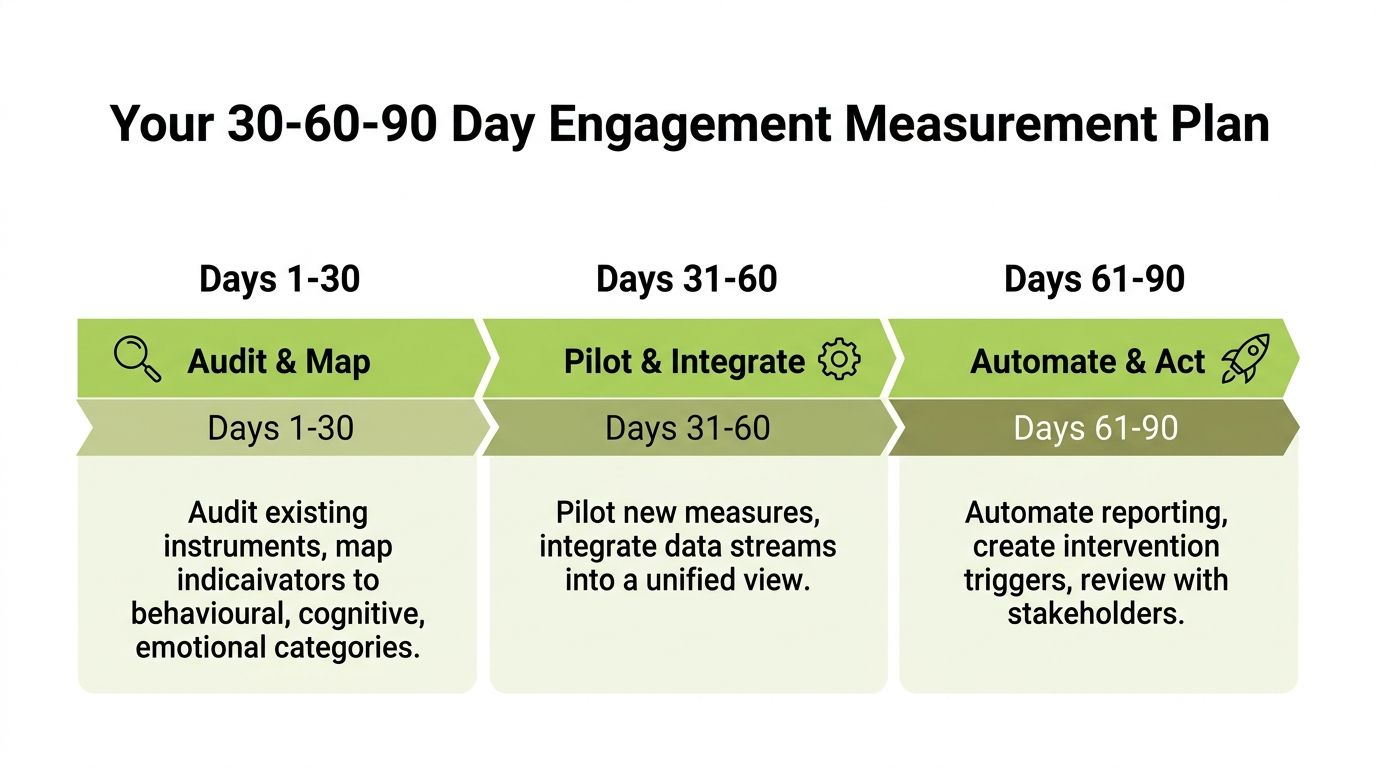
Your 30-60-90 Day Engagement Measurement Plan
A measurement programme becomes manageable when a team starts with one useful question, rather than trying to monitor everything.
Days 1 to 30, audit and map
List the surveys, LMS reports, attendance records, assessment rubrics and student feedback channels already in use. Mark each indicator as behavioural, cognitive or emotional. Remove duplicates that answer the same question poorly, and record gaps where a signal is missing.
Choose one primary question for the course, such as “Are students engaging cognitively during lab practicals?” The question determines the evidence worth collecting. A suitable set might combine a practical observation rubric, a short explanation task, a pulse question about confidence and relevant LMS activity. The aim is triangulation, not a larger dashboard.
Days 31 to 60, pilot and integrate
Use one survey, one rubric and one analytics source together. Ask two staff members to interpret the combined view independently, then compare the action each would take. Record at least one misleading metric you identify, such as repeated video access that reflects confusion rather than mastery.
Read video events with care. A completion event or repeated viewing can show interaction with a resource, but it does not prove attention or understanding. Place viewing patterns beside assessment explanations, tutor observations and student responses. This is particularly important when reviewing LMS-connected video analytics, including platforms such as MEDIAL.
Keep the pilot small enough for staff to discuss specific cases. They need to see how each measure behaves before the institution turns it into a formal reporting requirement.
Days 61 to 90, review and act
Compare relevant results with UKES expectations and local history, while allowing for differences in student groups, courses and learning contexts. Hold a 30-minute faculty review of the combined dashboard. Decide which indicators to retire, which need clearer definitions and which require an intervention trigger.
Write a short engagement brief for the next quality committee. Include the primary question, evidence used, interpretation, action taken and the next check. That record supports learning from the programme more effectively than a collection of unused charts.
The UK context supports structured monitoring. As noted earlier, UKES provides a benchmark for student engagement across participating institutions. In schools, the UK government reported that around 60% of schools and 76% of secondary schools measured factors related to pupil engagement and belonging, with an expectation that every school will monitor these indicators by 2029 (Department for Education publication).
Measurement becomes sustainable when someone protects 15 minutes each week to read the signals, ask what changed and decide whether a learner or learning activity needs attention. The habit matters more than the dashboard's appearance.
MEDIAL brings LMS-connected video management, viewing analytics, live streaming and video-based assignment workflows into one environment. Teams can place media behaviour beside cognitive and emotional evidence. Visit MEDIAL to explore how it can support a triangulated approach to student engagement measurement.
Comments